UK prices by year tell the story of how money has changed in your lifetime. Pick the year you were born, started work or bought your first home, and this tool shows what £100 was worth, what a house cost and what you paid in tax. It also shows interest rates, pensions, wages and more, each compared with today.
How to use the UK prices by year tool
The tool works on a phone or a laptop. Here is how to get the most from it.
Step 1: Pick a year
Choose any year from 1952 to 2026 in the box, or use the arrows to step through the years one at a time.
Step 2: Read the headline
The line under the year sums it up. It shows what £100 from that year is worth today and how much house prices have risen since.
Step 3: Compare then and now
Each card shows a figure for your year next to today’s figure, including how many years of pay an average home cost. Things that did not exist yet, such as ISAs before 1999, appear at the end.
Step 4: Explore the full charts
Every card links to one of our full charts, so you can see how that number changed year by year.
Step 5: Share your year
Tap Download my year to save a picture of your year that you can post on social media. Alternatively, tap Copy a link to this year to get a link that opens straight on your chosen year.
How UK prices by year have changed, decade by decade
Here is a snapshot of five years from the tool. All figures use the same official sources as our charts.
1970: £100 was worth over £1,600 today
In 1970 the average home cost £4,480 and Bank Rate was 7% in July. The full State Pension was just £5 a week, and £100 had the buying power of about £1,610 today.
1980: interest rates hit 17%
By 1980 the average house price was £23,288. Bank Rate stood at 17% in July, while the basic rate of income tax was 30% and the Personal Allowance was £1,375.
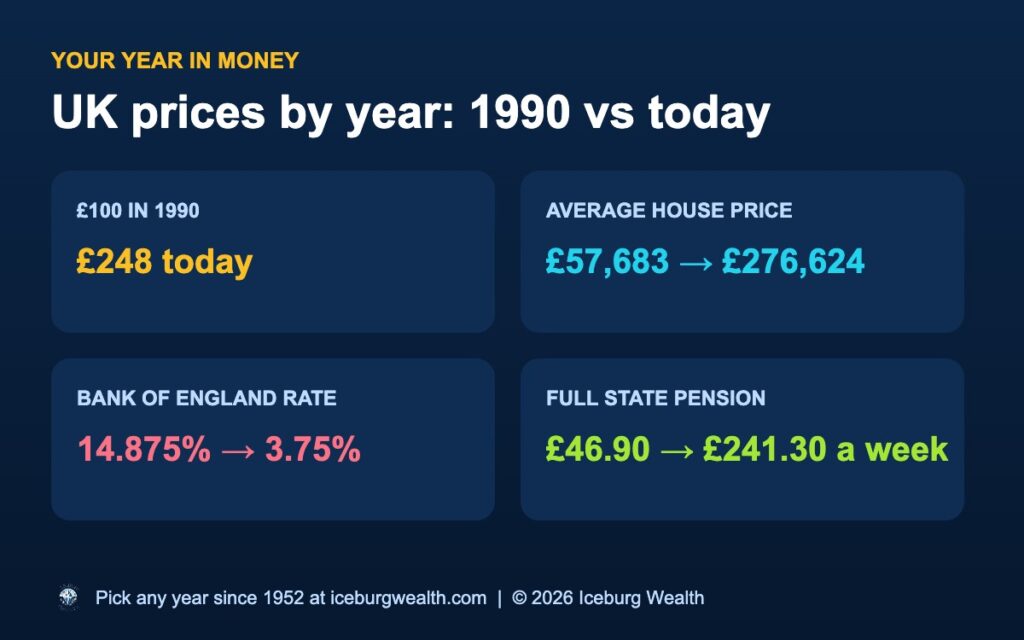
1990: homes cost under £60,000
In 1990 the average home cost £57,683, or about £143,000 in today’s money. Bank Rate was 14.875% in July, and the State Pension was £46.90 a week.
2000: the first years of the minimum wage
By 2000 the adult minimum wage was £3.60 an hour in July and the ISA allowance was £7,000. The average home cost £80,366, and Bank Rate was 6%.
2010: record low interest rates
In 2010 Bank Rate was just 0.5%, where it stayed for years. The average home cost £165,483, the Personal Allowance was £6,475 and national debt reached 70% of GDP.
Why house prices rose faster than everything else
One pattern stands out when you look at UK prices by year. Since 1990, general prices have risen about two and a half times, but house prices have risen nearly five times.
In today’s money, a typical 1990 home cost around £143,000. Today the average is £276,624, so homes have almost doubled in real terms. Meanwhile, since 1970, house prices have risen about 62 times while general prices have risen about 16 times.
Our UK house price history chart shows exactly when the big jumps happened, and our UK inflation calculator lets you check any amount from any year.
What your year in money means for you
Looking back is more than a bit of fun. It shows why saving in cash alone has struggled to keep up with prices, and why time in the market and owning assets has mattered so much.
If you want to make the most of the years ahead, start with our guide to building a simple index fund portfolio. You can find every chart behind this tool on our UK money charts page, and check today’s official figures on the ONS inflation pages.
UK prices by year FAQs
£100 in 1990 had the same buying power as about £248 in 2025 prices. In other words, prices have risen roughly two and a half times since then.
The average UK house price in 1980 was £23,288, based on the Nationwide yearly average. That is about £103,900 in today’s money, compared with an average of £276,624 now.
Bank Rate was 14.875% in July 1990. Today it is 3.75%.
The full basic State Pension was £23.30 a week in July 1980. The full new State Pension is £241.30 a week in 2026/27.
The tool covers every year from 1952 to 2026. It starts in 1952 because that is when the house price data begins.
The figures come from the same official sources as our charts, including the ONS, the Bank of England, HMRC, the DWP, GOV.UK and the Nationwide House Price Index.