How rich am I? It is one of the most searched money questions in the UK, and the honest answer depends on who you compare yourself with. A salary that sounds modest at 45 can put you near the top at 23. This free calculator shows where your pay ranks against people your own age, and against every UK taxpayer, using the latest official figures.
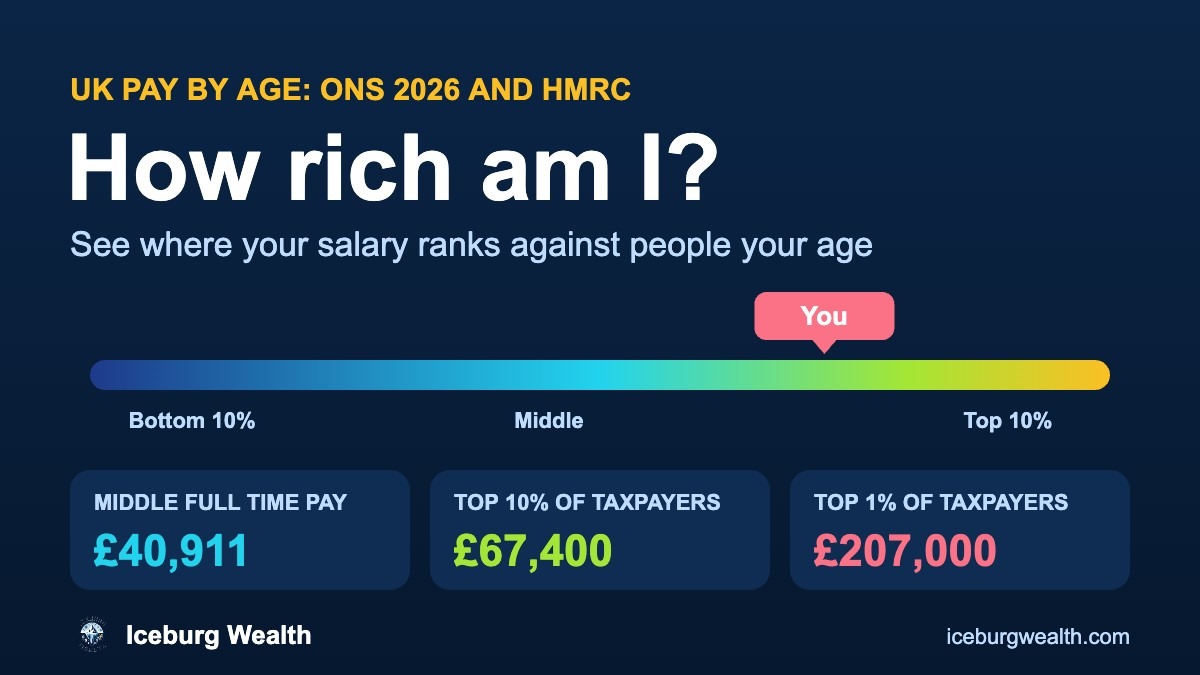
Where your pay sits among people your age. The ticks show the bottom 10%, the middle and the top 10%.
How your pay ranks at every age
Where the top starts: all UK taxpayers
| Top half | £29,700 |
| Top 10% | £67,400 |
| Top 5% | £93,600 |
| Top 1% | £207,000 |
How to use the how rich am I calculator
1. Enter your yearly pay
First, type your salary before tax, including any regular bonus or overtime. If you are paid hourly, multiply your hourly rate by your weekly hours, then by 52.
2. Pick your age group
Next, choose from six age bands, from 18 to 21 up to 60 and over, or pick all ages to see how you rank against the whole workforce.
3. Choose who to compare with
Generally, full time workers is the fairest comparison if you work full time. All workers includes part time staff, which pulls the figures down, so you will rank higher.
4. Read your result
The big number shows the share of people in your group you earn more than, and how big a pay rise would move you up a level. The cards show typical pay for your age, your rank among all taxpayers, where the top 10% starts and your take home pay each month.
Finally, underneath you can see how the same salary ranks in every age group. It is a handy way to see how much age changes the picture.
What counts as rich in the UK?
There is no official line, but the numbers give a good guide. Among people who pay income tax, the middle earner has a total income of about £29,700 a year. You need about £67,400 to reach the top 10%, about £93,600 for the top 5% and about £207,000 for the top 1%.
For full time employees, the middle salary in April 2026 was £40,911, and the top 10% started at about £82,680. So if you earn £50,000 you may not feel rich, but you earn more than roughly four in five people who pay tax.
How rich am I compared to people my age?
Pay tends to climb through your twenties and thirties, peak in your forties and then level off. Here is the middle full time salary for each age group in 2026:
- 18 to 21: £24,578
- 22 to 29: £33,678
- 30 to 39: £42,593
- 40 to 49: £46,280
- 50 to 59: £43,860
- 60 and over: £38,060
As a result, the same pay can give very different results. £40,000 puts a full time worker aged 22 to 29 in roughly the top third, but it sits below the middle for someone aged 40 to 49.
Income is not the same as wealth
Asking how rich am I is really a question about pay, not wealth. Someone on a high salary with a large mortgage and no savings may be less well off than someone on average pay who owns their home outright and has a healthy pension. If you want to build wealth over time, your savings rate matters more than your salary rank. To see how your wealth ranks instead, try our net worth tracker.
In addition, it helps to look at what you actually take home. Our take home pay calculator shows your pay after income tax and National Insurance, and where does my tax go shows how that tax is spent.
Where the figures come from
The age group comparison uses the ONS Annual Survey of Hours and Earnings 2026, which covers employee pay across the UK in April 2026. The figures are provisional and cover employees only, so self employed income is not included.
The all taxpayer ranking uses HMRC percentile points for total income before tax, from the Survey of Personal Incomes for 2023 to 2024. These cover everyone who pays income tax, including pensioners and the self employed, but not people who earn too little to pay tax. Your exact position is an estimate between the published points.
Ways to move up the rankings
- Check you are paid fairly for your role by comparing with the median salary in the UK.
- Ask for a pay rise with evidence of your results and what similar roles pay.
- Build skills or qualifications that lead to higher paid roles.
- Use salary sacrifice into your pension to cut your tax bill while you grow your savings.
Want to dig deeper? See how pay and prices have changed with your year in money, or browse the minimum wage history to see how the lowest pay has grown since 1999. You can also take our money personality quiz to see how your habits shape your money.
How rich am I? Your questions answered
Among UK taxpayers, you need a total income of about £67,400 a year to be in the top 10%, based on HMRC figures for 2023 to 2024. For full time employees, the top 10% started at about £82,680 in April 2026.
You need a total income of about £207,000 a year to be in the top 1% of UK taxpayers, according to HMRC.
The middle (median) salary for full time employees was £40,911 in April 2026, according to the ONS. For all employees, including part time workers, it was £34,229.
Yes. £50,000 is above the median for full time workers of every age group, and it puts you in roughly the top 20% of UK taxpayers.
Full time pay peaks between 40 and 49, where the median salary was £46,280 in 2026. It then falls slightly for people in their fifties and sixties.
The age comparison uses ONS data on employees, so it does not include self employed income. The all taxpayer ranking uses HMRC data, which does include self employed people and pensioners who pay income tax.